multiMS-toolbox
multiMS-toolbox is an R software (https://www.r-project.org/) toolbox to efficiently search for differences in mass-spectrometry samples from long-term experiments. The software allows you to:
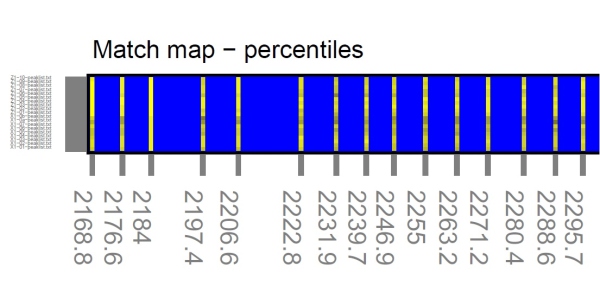
- match the appropriate peaks or peak clusters among the different samples and replace the peaks of the same isotope group by one group peak if required, approximate the values for the missing peaks,
- normalize the data according selected method (normalization by spectrum median, by spectrum area, by sum of matched peak areas or intensities),
- run a principal component analysis on processed data,
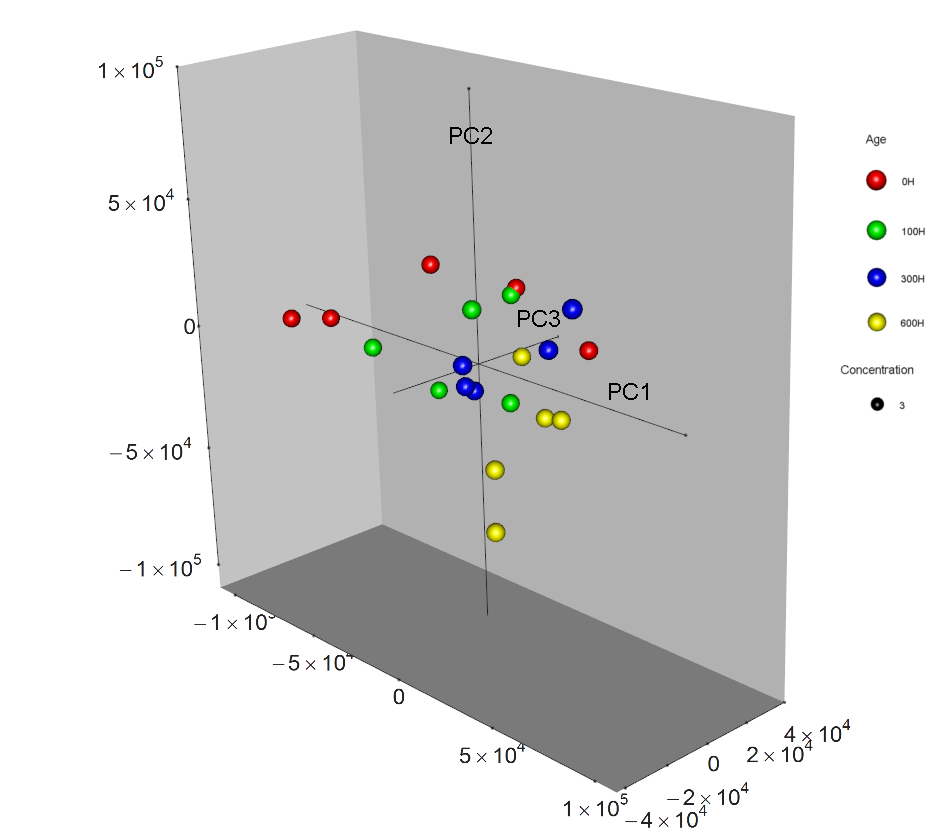
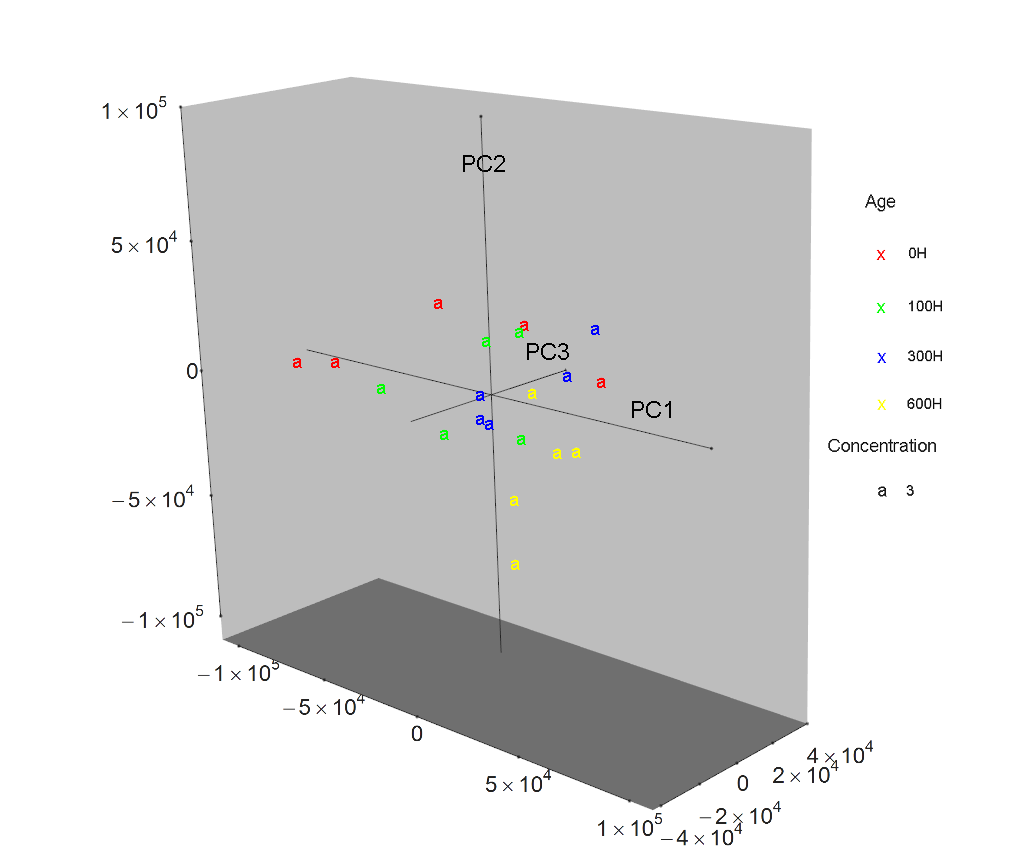
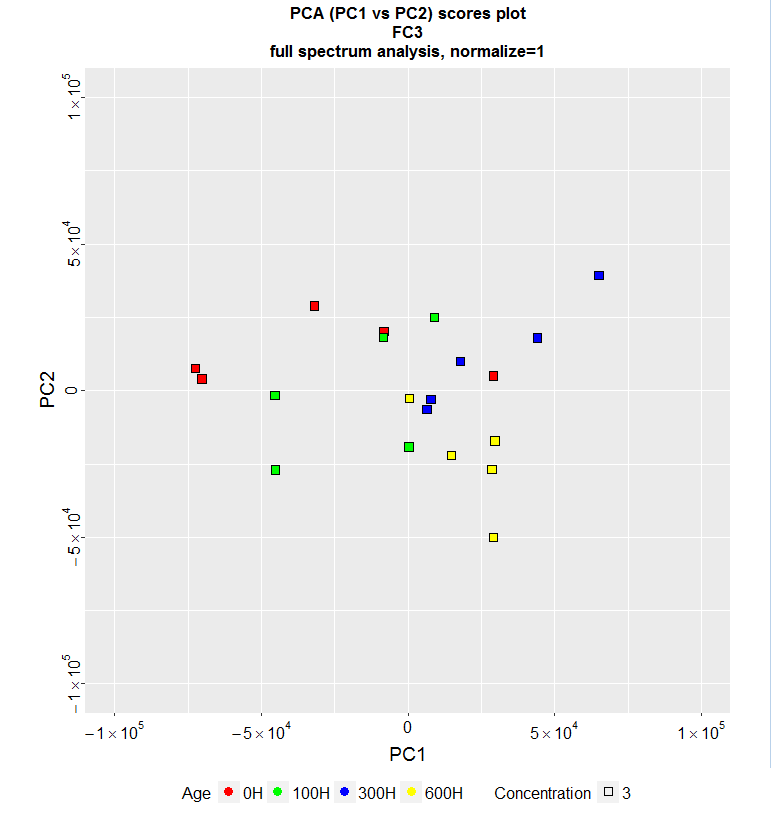
- group samples together, drawing the PCA scores plot (data samples plot) and PCA loadings plot between dominant principal components, drawing the 3D PCA scores plot,
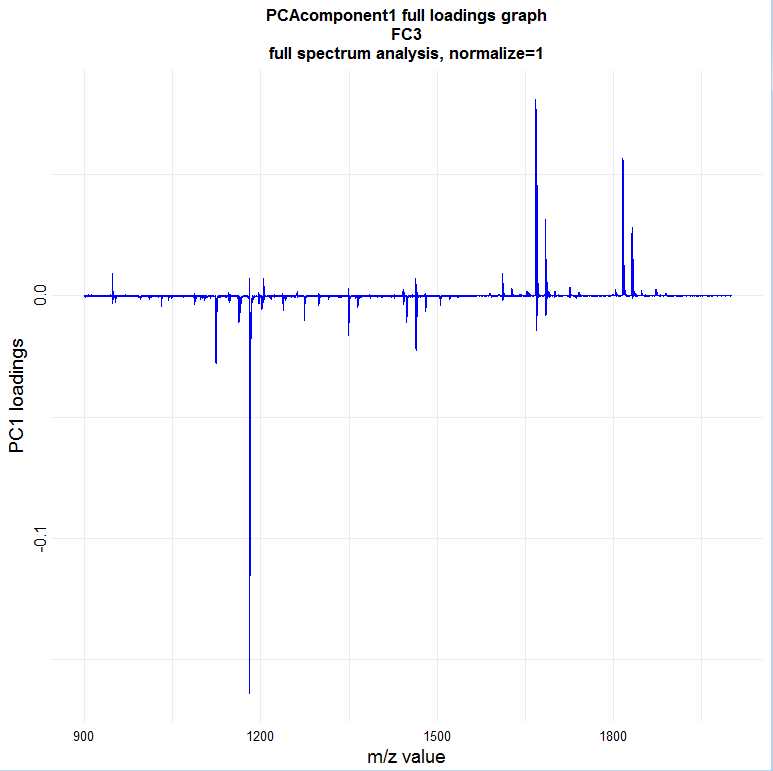
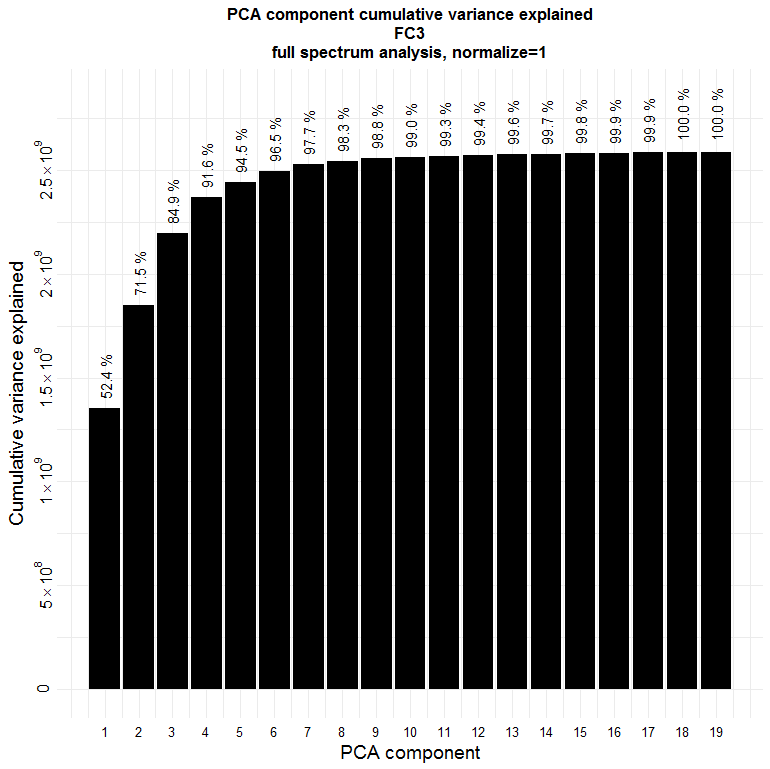
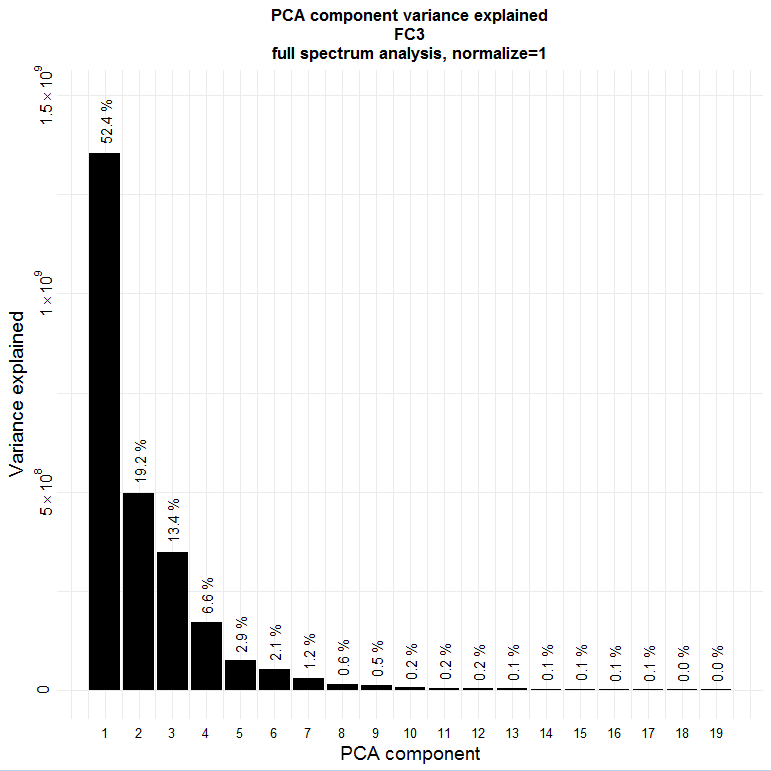
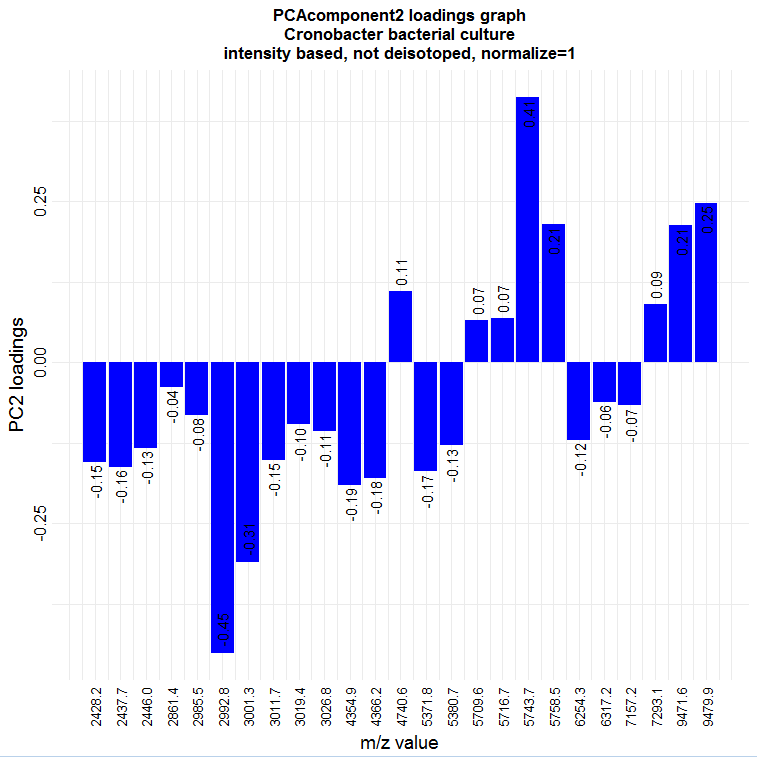
- export and analyze each PCA component, draw the graphs of the most important PCA loadings and the most important peaks in the spectra,
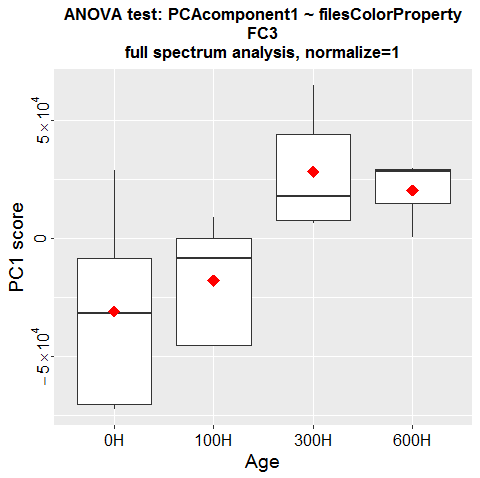
- run analysis of variance (ANOVA) for each principal component and all sample groups,
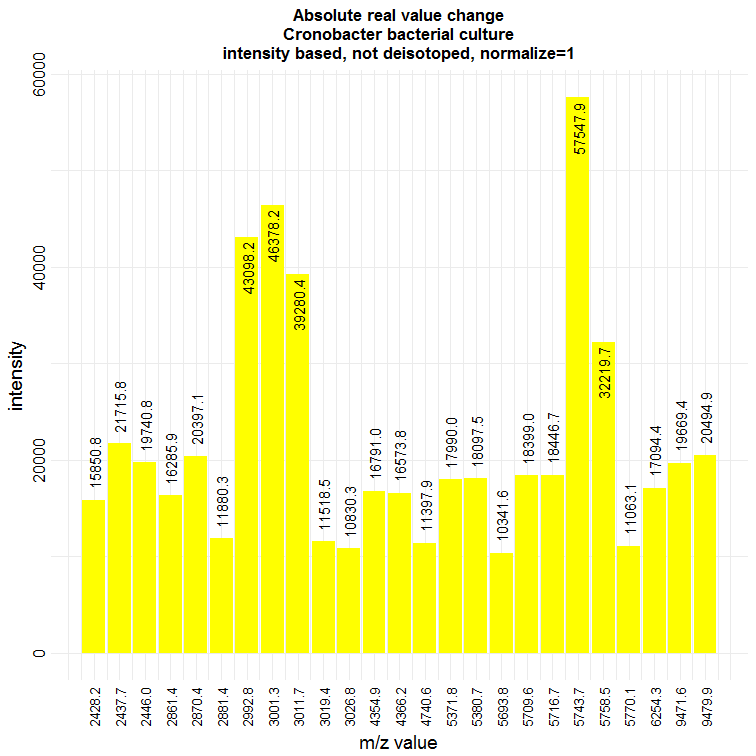
- draw other graphs for later analysis, like the most important changes of absolute and relative intensities or areas of the peaks and peak clusters, output all the results to csv, txt, pdf files for later analysis.
- run full spectrum analysis
See more in User guide...
Last modified: 28.08.2023